I’m working on a large project that can render up to 5,000 items on a page at once. In general, we try to follow fragment colocation, where a component uses useFragment to declare its data requirements. However, we’re seeing memory/CPU overhead from the increasing number of cache watches, many of which are duplicates for the same data.
For example, say we have a hierarchical schema where a child has a parent and a grandparent. Some child components may need data on the child, parent, grandparent, current member. The useFragment on the non-child types creates duplicate watches for each rendered child component.
I’ve created this repo to demonstrate this: GitHub - jcostello93/apollo-client-dupe-watches
Scenario A: Duplicate Leaf Watches
Each leaf node creates a useFragment on the parent. To simulate the repeat watches described above (grandparent, member, etc), there are 4 duplicates per item.
Results:
Scenario B: Context-Based Approach
The parent data is accessed via React context instead of individual useFragment calls in each leaf.
Results:
We’re currently weighing the trade-offs between these two approaches in our project. On the one hand we want to stick to fragment colocation, but on the other we see performance improvements by moving certain fragments (on the grandparent, member, etc) to context to avoid repeat watches. We wanted to check in and see if you have any thoughts on this. Thanks!
1 Like
Hey @jcostello 
Would you be interested in trying the 4.1.0-alpha.3 release? We’ve added deduplication on watchers created by watchFragment (the underlying API that powers useFragment) and I’m hoping that improves the situation here. Per the release notes:
- #12971
d11eb40 Thanks @jerelmiller! - Deduplicate watches created by useFragment, client.watchFragment, and cache.watchFragment that contain the same fragment, variables, and identifier. This should improve performance in situations where a useFragment or a client.watchFragment is used to watch the same object in multiple places of an application.
I would be grateful if you could try this out and let us know if you see any improvements!
Wow, happy to see that’s already in the works for v4! I upgraded the client to 4.1.0-alpha.3 in the repro and can confirm there are now only 2 cache watches in both scenarios. However, I’m still seeing higher memory usage and slower performance in Scenario A.
Scenario A:
- Number of watches: 2
usedJSHeapSize: 231MBbroadcastWatches time when clicking “Update parent.name”: 375ms- INP when clicking “Update parent.name”: 888ms
Scenario A:
- Number of watches: 2
usedJSHeapSize: 81MBbroadcastWatches time when clicking “Update parent.name”: 2ms- INP when clicking “Update parent.name”: 160ms
I’ll see if I can dig in a bit further. I’m unsure whether this is specifically because of watchFragment or due to the processing time it takes React to process the update from useFragment. We use useSyncExternalStore in useFragment to tell React to update. The difference in these situations is that an update to the parent.name will tell 5000 useSyncExternalStore hooks to update, where the context situation will update components using that context to rerender. I’m unsure how much React does batching with useSyncExternalStorewhen a bunch are called in quick succession. Let me see if I can dig into that a bit more (@lenz you might know more here).
Scratch that. I see you’re recording the broadcastWatches time here. Let me see how much of that interaction time is due to the broadcast vs React here. broadcastWatches is synchronous and that triggers the observable next notification synchronously so there might be a mix of things at play here.
Ok I see quite a bit of time spent in the Observable portion of the call so I think there might be more we can investigate. While we dedupe watchers, we still create 1:1 number of observables to watchFragment calls. I’ll play around with this some more and see if its possible for us to try and dedupe on the total number of created observables as well. Your reproduction will be super helpful to try and measure progress here so thanks for providing that!
2 Likes
Hey @jcostello
I’ve been playing around with this a bit more in Reuse observables in `client.watchFragment` as much as possible by jerelmiller · Pull Request #13026 · apollographql/apollo-client · GitHub and I’ve managed to bring down the broadcast time quite a bit by reducing the number of observables created. Previously we’d get at least 1 per useFragment, but now it will reuse observables as much as possible and only create them for unique items. Using your reproduction, I’ve seen a pretty dramatic increase in performance.
Unfortunately it’s not quite as performant as the context use case, but its not nearly as far behind anymore. On my machine, the 5000 item use case went from ~60-70ms per broadcast on average to about ~15-20ms. I’d love for you to try out the PR build in on your end to see if how it works for you.
npm i https://pkg.pr.new/apollographql/apollo-client/@apollo/client@13026
On the context front, I think React might be doing some special things here to make this case performant. useFragment uses useSyncExternalStore under the hood and I think running this on 5000 items is a bit slower than React performing context updates, but that said, I’m not entirely sure all the under-the-hood mechanics that React does here.
Let me know how this works for you! I’m going to continue to experiment a little more to see if I can get any more performance gains, but otherwise I’m pretty happy with the updates in the PR already. Thanks again for raising the issue!
Thanks for sharing the branch! Pushed a commit to the repro with the new version.
Overall, definitely seeing some improvements in memory usage, broadcastWatches, and INP:
| Browser |
Scenario |
Fragments per Item |
usedJsHeapSize |
broadcastWatches |
INP |
| Chrome |
A |
4 |
~125mb (↓ from 231mb) |
~210ms (↓ from 375ms) |
~700ms (↓ from 888ms) |
| Chrome |
A |
1 |
~85mb (↓ from 105mb) |
~72ms (↓ from 110ms) |
~250ms (↓ from 400ms) |
| Chrome |
B |
- |
~60mb |
~5ms |
~160ms |
| Firefox |
A |
4 |
- |
~30ms (↓ from 200ms) |
- |
| Firefox |
A |
1 |
- |
~15ms (↓ from 70ms) |
- |
| Firefox |
B |
- |
- |
~5ms |
- |
Some thoughts:
Memory usage seems down across the board.
Seeing better broadcastWatches performance in Firefox than Chrome. In the one fragment per item scenario, it’s 15ms vs 70ms in Firefox vs Chrome, respectively. That jumps to 30ms vs 210ms in the 4 fragment per item case.
Still seeing a noticeable performance tax with the duplicate fragments. At 250ms broadcastWatches and 700ms INP, the context approach still gives significant performance gains (comparatively 5ms broadcastWatches and 160ms INP). Should we expect less of an impact here with reduction in new observables?
Here are some comparison traces for Scenario A with 1 fragment and Scenario B
And for Scenario A with 4 fragments vs Scenario B
Should we expect less of an impact here with reduction in new observables?
I’m not entirely sure and to be honest, I don’t know that we will be able to match the performance of context simply because there is just more going on when scenario A. While that PR I opened does reduce the total number of observables down to the number of unique from items (in this case, 1 observable total for all 5000 components… errr I guess 20000 or more in the case of 4 duplicate items), we still subscribe to that observable 5000/20000 times. When the cache broadcast happens, its running those 5000/20000 callbacks which then call the updater function from useSyncExternalStore in those 5000/20000 components. That is likely to be slower than any optimizations React has in place with updating context values where the value that is changing is done in a single place with the provider. I should note that useFragment also schedules those updates with setTimeout so it has to allocate 5000/20000 timers before the update is applied for each of those useFragment calls.
Again, I don’t entirely know all the specifics of how React does context updates other than I know that it can target specific components and rerender them with the new value, but obviously there are no React state updates in the process.
At this point I can’t think of any other way we can squeeze out more performance. With the reductions in the number of watchers and the number of observables, I think we’re now at the mercy of the performance of RxJS and React when the observable emits a value. I don’t believe the performance of cache.diffplays a significant role here anymore since we are only down to 2 watchers. I think most of the processing happens after observer.next()which is a bit out of our hands.
If you have other ideas, I’m all ears!
One other note I wanted to mention while I was testing, I did see a significant performance hit when running this with devtools open. My timing of 15-20ms in Chrome was devtools closed. I saw closer to the 1s cache broadcast time when I was recording performance profiles, so take that 1s update time with a grain of salt (I’m sure you already know that, but just wanted to state where I got my timing from  )
)
1 Like
Got an interesting test because I wanted to see how just the core API performed with a similar setup. I added this to the component and commented out the components that use useFragment
  React.useEffect(() => {
    const pref = { __typename: "Parent", id: PARENT_ID };
    const subscriptions = Array.from({
      length: items.length * duplication,
    }).map(() => {
      let timeoutId = 0;
      const observable = client.watchFragment({
        fragment: ParentName_fragment,
        from: pref,
      });

      return observable.subscribe({
        next: () => {
          clearTimeout(timeoutId);
          setTimeout(() => {});
        },
      });
    });

    return () => {
      subscriptions.map((sub) => sub.unsubscribe());
    };
  }, [duplication, items]);
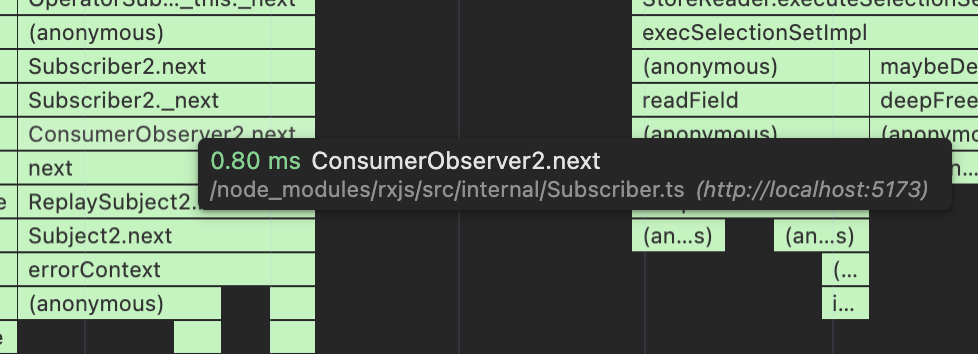
This is a very simplified version of what’s happening in useFragment (without the React bits of course). What’s really interesting is that adding the timers adds pretty significant overhead. If I comment out the clearTimeout/setTimeout calls inside that nextcallback, I see the broadcastWatches update takes around ~3-5ms. As soon as I add those timers, it jumps to about 15-20ms, which is about the same timing I’m seeing with useFragment. Here is the flamegraph where you can see most of the time spend with an update here is in the RxJS code trying to run the next callback:
And here is the flamegraph without the clearTimeout/setTimeout:
The allocation of 20000 timers here certainly seems like the bottleneck in this case. Unfortunately removing them in useFragment might not be something we can do. Plus it the tradeoff here is that we tell React to update those 20000 components synchronously, which will add some overhead to the broadcastWatches.
I’ll talk with @lenz after US Thanksgiving and see if it makes sense for us to at least introduce a setting that determines whether to run that update to useSyncExternalStore synchronously or not (it may or may not help your real application).
1 Like
I did see a significant performance hit when running this with devtools open
Thank you for pointing this out! I had dev tools open in Chrome to keep an eye on memory usage. With it closed, the broadcastWatches timing is about the same as Firefox. So, a really significant improvement.
I was able to create a test head of our app using the branch you shared. I’m seeing somewhere between a 40-50% reduction in time in broadcastWatches (compared to v3.13.9) in some of the more extreme cases that I tried to simulate in the repro.
1 Like
Thats great to hear! We’ll try and get another alpha published sometime after Thanksgiving then! Appreciate you letting me know!
We just released 4.1.0-alpha.6 which includes this change. Appreciate the help validating this change!
1 Like
Thank you so much for rolling this out!
One question: do you know if it would be possible to do something similar for watchQuery observables? In the past we’ve had spikes of cache writes and broadcasts from repeat query watches, which can add up unexpectedly when using the same component across different parts of the UI.
Happy to create another post/repro if it helps but figured I’d follow up here first
@jcostello unfortunately we don’t have a lot of capacity for the moment (or the near future) to dig into that further. If its something that interests you, we’d be happy to discuss a plan to implement and accept a contribution.
That sounds good! Would be interested to discuss a potential implementation and what that might look like 
1 Like